Hi, I have a very basic question about how to interpret the colored overlays in the automatically generated BOLD QC images, specifically the white and light blue borders in *fMRIQC.wb_scene1.png. I was not able to find an answer in the qunex documentation or in some materials from past HCP workshops that I looked at.
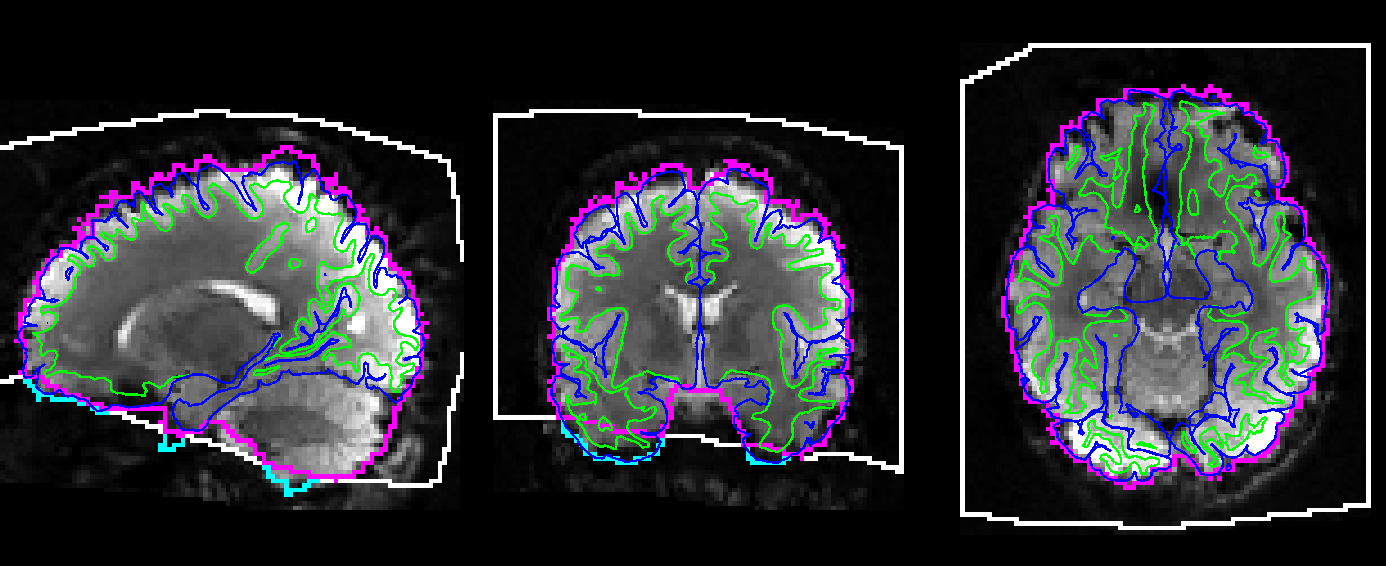
The blue and green lines represent the pial and WM boundaries, and the pink appears to be the outer edge of the BOLD brain mask. In some cases (see ventral portions of attached image for example) the white box “cuts off” a portion of the brain, and the edge of the BOLD mask outside the white border is highlighted in light blue. However, those regions usually appear to be within the original field of view for both the structural and functional scan. Do these light blue borders indicate regions where the registration failed, or do they have a different meaning? Thank you!
Hi,
could you please provide the command call that you used. The automatically generated pngs in my case look completely different (see the image attached below).
Jure
Hi Jure,
Thanks for your help. These QC images were actually not generated with a specific call to run_qc, they are output for each session during hcp_fmri_surface in $session/hcp/$session/MNINonLinear/Results/$bold/fMRIQC/snapshots/
Here is an example hcp_fmri_surface call:
qunex hcp_fmri_surface --hcp_processing_mode=HCPStyleData --sessions=/u/project/cbearden/data/22qPrisma/qunex_studyfolder/processing/22qPrisma_batch.txt --sessionsfolder=/u/project/cbearden/data/22qPrisma/qunex_studyfolder/sessions --parsessions=1 --overwrite=yes
Thank you!
Oh, these are than actually the QC images generated by HCP pipelines. I can ask around the team if someone knows what exactly is in them and what one should look for. Unfortunately, I do not know this. Maybe a good place to ask this would be the HCP users group: https://groups.google.com/a/humanconnectome.org/g/hcp-users.
Jure
1 Like